ROI of AI Medical Coding: A Data-Driven Analysis
Healthcare organizations spend between 3% and 5% of net patient revenue on coding operations alone, yet the return on that investment is declining. Coder shortages are intensifying, denial rates are climbing, and CMS audit exposure under RADV is creating seven-figure financial risk. Against that backdrop, AI-assisted medical coding has moved from a speculative technology to a measurable capital investment -- one that demands the same rigorous financial analysis as any other operational decision.
This article builds a concrete, data-driven ROI model for AI medical coding. Every number is sourced from industry benchmarks, and the framework is designed so that healthcare finance and RCM leaders can adapt it to their own volumes and cost structures.
The True Cost of Manual Medical Coding
Before calculating AI returns, you need an honest picture of what manual coding actually costs. Most organizations undercount because they focus on coder salaries and ignore the surrounding cost structure.
Direct Labor Costs
According to the AAPC 2025 Salary Survey, the average medical coder in the United States earns between $55,000 and $75,000 in base salary, with certified risk-adjustment coders at the higher end of that range. The Bureau of Labor Statistics (Occupational Outlook Handbook, Medical Records Specialists, 2025 edition) reports a median annual wage of $48,780 for the broader medical records category, but this figure understates the true cost for experienced HCC and E/M coders, who command a premium due to specialization.
Salary, however, is only the starting point. A fully loaded cost model must account for:
- Benefits and payroll taxes: Typically 25-35% above base salary
- Training and continuing education: AAPC certification maintenance, ICD-10 update training, HCC model transition education (V24 to V28)
- Quality assurance: Most organizations dedicate 10-15% of coding staff time to QA audits and rework
- Management overhead: Coding supervisors, team leads, and compliance officers
- Technology: Encoder software licenses, EHR access, and workstation costs
- Turnover and recruitment: AHIMA workforce studies consistently report a 30% shortage of qualified medical coders nationwide, which drives up recruitment costs and extends time-to-fill for open positions
When you add these layers together, the fully loaded cost per coder ranges from $80,000 to $110,000 annually.
Cost-Per-Chart Calculation
The industry benchmark for manual coding cost-per-chart falls between $3.00 and $5.00, depending on chart complexity, code type, and coder experience level. Here is how that number is derived:
A productive medical coder processes approximately 20-25 charts per hour for standard evaluation and management (E/M) coding, and 10-15 charts per hour for complex risk-adjustment (HCC) coding. At an average of 10-20 minutes per chart across a blended case mix, a full-time coder produces roughly 10,000-15,000 coded charts per year.
Taking the midpoint -- 12,000 charts per year at a fully loaded cost of $95,000 -- yields a cost-per-chart of approximately $7.92. However, many organizations use outsourced or offshore coding for a portion of their volume, which brings the blended average down to the $3.00-$5.00 range that industry benchmarks reflect. For this analysis, we will use $4.00 per chart as the blended manual coding cost.
Hidden Costs: Denials, Rework, and Audit Exposure
The per-chart figure above captures only the production cost. It does not include the downstream financial impact of coding errors:
-
Claim denials: CMS and commercial payer data show that initial denial rates across the industry run between 10% and 15% of all claims submitted. According to a 2024 Experian Health survey, the average cost to rework a denied claim is $25-$30. For an organization submitting 50,000 claims per year, a 12% denial rate generates 6,000 reworked claims at roughly $165,000 in annual rework cost alone -- before accounting for claims that are never recovered.
-
Revenue leakage from undercoding: McKinsey's 2024 report on healthcare AI adoption estimated that coding inaccuracies -- particularly undercoding of HCC risk scores -- cost health plans and provider organizations between 1% and 3% of risk-adjusted revenue annually.
-
RADV audit exposure: CMS Risk Adjustment Data Validation audits use extrapolated findings. A single HCC coding error extrapolated across a patient population can result in repayment demands of $2 million to $10 million or more, depending on plan size. This is not a theoretical risk -- CMS finalized its RADV audit methodology rule in January 2025, and extrapolation is now the standard enforcement approach.
The Six Dimensions of AI Coding ROI
AI medical coding ROI is not a single number. It spans six measurable dimensions, each with its own financial impact.
1. Direct Labor Cost Savings
Organizations that deploy AI coding at scale consistently report a 30-40% reduction in coding labor costs. This does not mean eliminating coders -- it means shifting coder roles from production coding to exception review and quality oversight, while processing the same or greater volume with fewer FTEs.
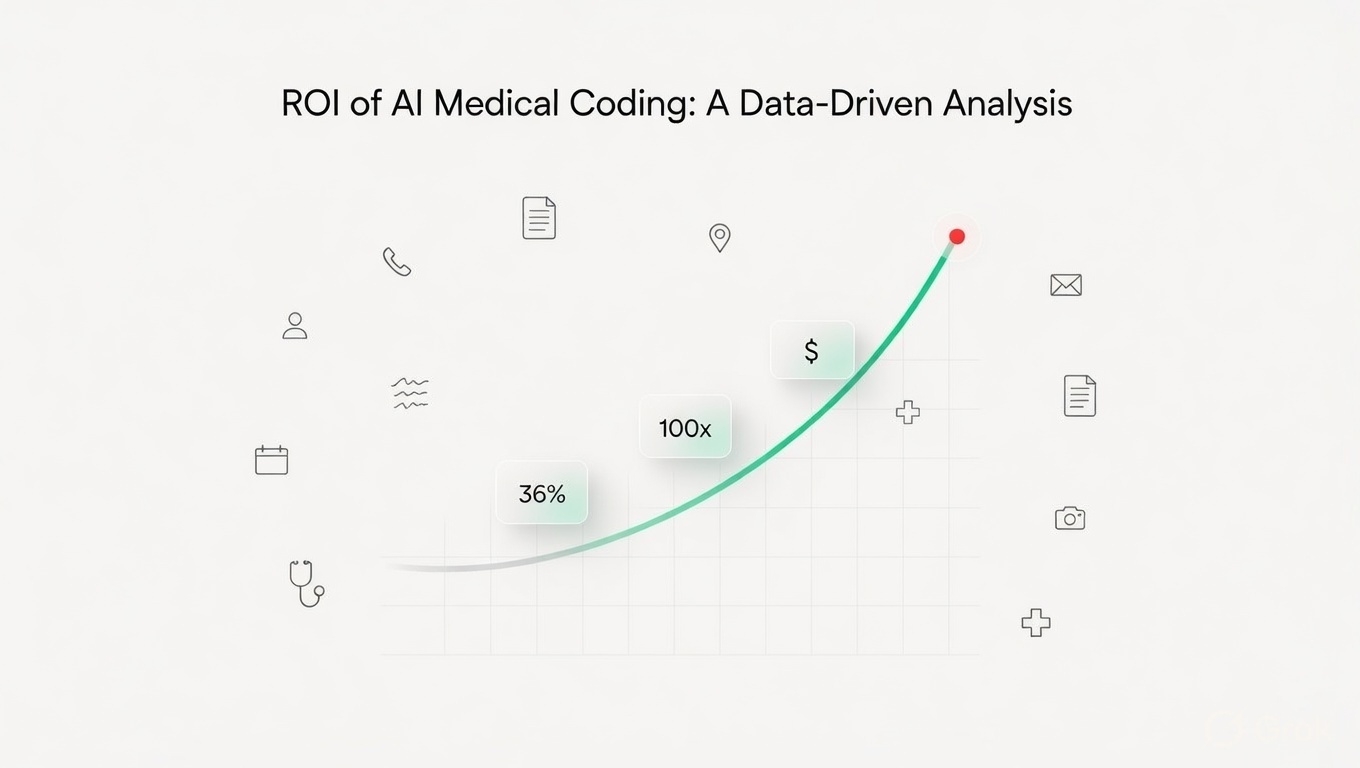
For an organization with 10 full-time coders at an average fully loaded cost of $95,000 each, a 36% labor reduction translates to a savings of approximately $342,000 per year. The remaining coders focus on complex cases, AI exception queues, and compliance oversight -- higher-value work that improves both job satisfaction and organizational accuracy.
2. Speed and Throughput Gains
Manual coding requires 10-20 minutes per chart. AI coding engines process charts in seconds. Jivica's ANICA platform, for example, processes a chart in 5-15 seconds using a multi-agent architecture of 9 specialized AI agents -- a throughput improvement of roughly 100x.
This speed advantage has direct financial impact beyond labor savings. Faster coding means faster claim submission, which accelerates days in accounts receivable (A/R). Deloitte's 2025 Healthcare Financial Management report found that organizations reducing coding turnaround from 48 hours to same-day submission improved A/R by an average of 3-5 days, which for a mid-size organization translates to a cash flow improvement of $200,000-$500,000 in working capital.
3. Accuracy Improvements and Denial Prevention
Human coder accuracy ranges from 60% to 85% depending on code type, case complexity, and coder experience, according to AHIMA benchmarking studies. AI systems trained on large clinical datasets achieve higher consistency. ANICA achieves 92.6% accuracy across ICD-10, HCC, and E/M coding categories.
The accuracy differential directly reduces denial rates. If an organization's coding-related denial rate drops from 12% to 6% -- a conservative estimate for the accuracy improvement from 75% to 92%+ -- that cuts rework volume in half. On 50,000 annual charts, that is 3,000 fewer denied claims per year, saving approximately $82,500 in rework costs (at $27.50 per reworked claim) and recovering revenue that would otherwise be lost to write-offs.
4. Denial Rate Reduction Through Pre-Submission Validation
Beyond raw accuracy, AI coding platforms catch errors before claims are submitted -- a fundamentally different workflow from manual coding, where errors are discovered only after denial. Pre-submission validation identifies missing documentation, unsupported diagnoses, and code-edit conflicts in real time.
Organizations processing 50,000 charts annually with a 12% baseline denial rate can expect to reduce coding-related denials by 40-60% through AI pre-submission validation. At an average denied claim value of $250, recovering even half of previously denied claims represents $375,000 to $562,500 in additional annual revenue.
5. RADV Audit Protection
CMS RADV audits target HCC coding accuracy, and the financial exposure from extrapolated findings dwarfs the cost of any coding operation. AI coding platforms that embed MEAT criteria validation (Monitoring, Evaluating, Assessing/Addressing, Treating) and maintain full evidence trails for every code assigned provide a structural defense against audit findings.
The ROI of RADV protection is probabilistic -- it depends on whether your organization is audited and what findings result. But given CMS's expansion of RADV audits and the finalization of extrapolation methodology, the expected value of this protection is significant. Organizations managing 50,000+ risk-adjusted lives should model RADV exposure as a $1 million to $5 million contingent liability. AI coding that reduces unsupported codes by 80%+ materially reduces this exposure.
ANICA, for instance, generates a complete evidence trail for every HCC code it assigns, mapping each diagnosis to specific clinical documentation that satisfies MEAT criteria -- the exact documentation that RADV auditors evaluate.
6. Scalability Without Proportional Cost Increase
Manual coding scales linearly: doubling your chart volume requires doubling your coding staff. AI coding scales at marginal cost. An AI platform that processes 10,000 charts per day can handle 20,000 with minimal incremental cost -- no hiring, no training, no ramp-up period.
This scalability has particular value during volume spikes: open enrollment periods, M&A integrations, and retrospective chart reviews. Organizations that previously outsourced surge coding at premium rates ($5-$8 per chart) can instead absorb those volumes through their AI platform at their standard per-chart cost.
Sample ROI Calculation: Mid-Size Organization
The following model calculates projected annual ROI for a mid-size healthcare organization processing 50,000 charts per year with a coding team of 8 FTEs.
Assumptions
| Parameter | Value |
|---|---|
| Annual chart volume | 50,000 |
| Current coding FTEs | 8 |
| Fully loaded cost per coder | $95,000 |
| Manual cost per chart (blended) | $4.00 |
| Current denial rate (coding-related) | 12% |
| Average denied claim value | $250 |
| Cost to rework a denied claim | $27.50 |
| AI coding platform annual cost | $150,000 |
Cost Comparison: Manual vs. AI-Assisted Coding
| Cost Category | Manual Coding | AI-Assisted Coding | Annual Savings |
|---|---|---|---|
| Coding labor (FTEs) | $760,000 (8 FTEs) | $486,400 (5.1 FTEs) | $273,600 |
| Denial rework costs | $165,000 (6,000 denials) | $74,250 (2,700 denials) | $90,750 |
| Revenue lost to write-offs | $375,000 | $150,000 | $225,000 |
| Outsourced surge coding | $60,000 | $0 | $60,000 |
| AI platform cost | $0 | $150,000 | ($150,000) |
| Total annual cost | $1,360,000 | $860,650 | $499,350 |
Key Metrics
| Metric | Value |
|---|---|
| Total annual savings | $499,350 |
| ROI (Year 1) | 233% (savings / AI platform cost) |
| Payback period | 3.6 months |
| Cost per chart (AI-assisted) | $1.72 vs. $4.00 manual |
| Denial rate reduction | 12% to 5.4% |
| FTE reduction | 8 to 5.1 (36% reduction) |
Organizations processing 50,000 charts annually can expect approximately $500,000 in total annual savings from AI-assisted coding, with a payback period under four months. The cost-per-chart drops from $4.00 under manual coding to approximately $1.72 with AI assistance -- a 57% reduction.
Sensitivity Analysis
The model above uses conservative assumptions. Here is how the ROI changes under different scenarios:
| Scenario | Annual Savings | ROI |
|---|---|---|
| Conservative (30% labor reduction, 30% denial reduction) | $362,000 | 141% |
| Base case (36% labor reduction, 50% denial reduction) | $499,350 | 233% |
| Optimistic (42% labor reduction, 60% denial reduction) | $621,000 | 314% |
Even under the conservative scenario, the investment pays back in under six months.
Breakeven Analysis
The breakeven point for AI coding adoption depends primarily on chart volume and current cost structure. At an AI platform cost of $150,000 per year:
- At $4.00 manual cost per chart and $1.72 AI-assisted cost per chart: Breakeven at approximately 65,800 charts per year on labor savings alone (not counting denial reduction or revenue recovery)
- Including denial reduction benefits: Breakeven drops to approximately 25,000-30,000 charts per year
- For organizations with higher manual costs ($5.00+ per chart): Breakeven can occur at volumes as low as 15,000 charts per year
The critical takeaway: any organization processing more than 25,000 charts per year is almost certainly leaving money on the table by not deploying AI-assisted coding.
What to Look for in an AI Coding Platform
Not all AI coding solutions deliver the same ROI. When evaluating platforms, healthcare finance leaders should assess:
-
Accuracy benchmarks: Demand published accuracy rates across ICD-10, HCC, and E/M categories, validated on independent datasets. A platform claiming "high accuracy" without publishing numbers is a red flag.
-
Evidence trail completeness: For RADV protection, every AI-assigned code must link back to specific clinical documentation. This is non-negotiable for risk-adjustment coding.
-
Processing speed at scale: Verify throughput claims at your actual volume levels. A system that processes 100 charts in 15 seconds may not maintain that speed at 10,000 charts per day.
-
Integration capabilities: The ROI model assumes seamless integration with your existing EHR and billing systems. Manual data transfer between systems erodes speed and accuracy gains.
-
Transparent pricing: AI coding should be priced on a per-chart or subscription basis that you can model into your cost-per-chart calculation. Avoid platforms with opaque pricing that makes ROI analysis impossible.
Jivica's ANICA platform is purpose-built for these requirements: 92.6% accuracy across coding categories, 5-15 second processing per chart, 9 specialized AI agents providing multi-layered validation, full MEAT criteria evidence trails, and capacity to process over 10,000 charts per day. The platform is designed to integrate into existing RCM workflows rather than replace them.
Building Your Business Case
To adapt this ROI framework to your organization, gather the following data points:
- Annual chart volume by code type (E/M, HCC, procedural)
- Current coding FTE count and fully loaded cost per coder
- Blended cost per chart (include outsourced coding if applicable)
- Coding-related denial rate and average denied claim value
- Annual spend on rework and appeals
- Surge coding costs (seasonal outsourcing, backlog clearance)
- RADV audit history or risk-adjusted lives under management
With these inputs, you can populate the model above with your own numbers and present a defensible financial case to your CFO or board.
The Bottom Line
The ROI of AI medical coding is not speculative. Organizations processing 50,000 charts annually can expect approximately $500,000 in total annual savings, a payback period under four months, and a cost-per-chart reduction of 57%. These figures are derived from published industry benchmarks and conservative assumptions.
The question for healthcare finance leaders is no longer whether AI coding delivers ROI -- the data is clear that it does. The question is how quickly your organization can capture these savings before rising coder shortages, expanding RADV audits, and increasing denial rates erode your current margins further.
Ready to model the ROI for your organization? Use our ROI Calculator to input your specific volumes and cost structure, or contact our team for a detailed financial analysis tailored to your operation.